Workplace :

| office: | B116 |
|---|---|
| tel: | (+33)47340 5368 |
Stochastic Dial-a-Ride problem (SDARP)
Title:
Determination of robust solutions for the DARP with variations in transportation time
Autors:
 |
Maxime Chassaing |
 |
Christophe Duhamel |
 |
Gérard Fleury |
 |
Philippe Lacomme |
Abstract
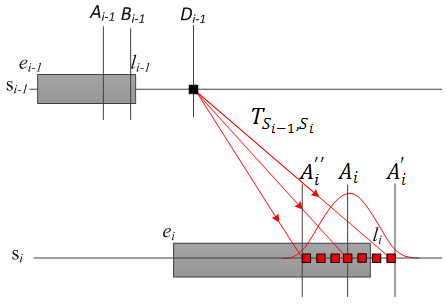
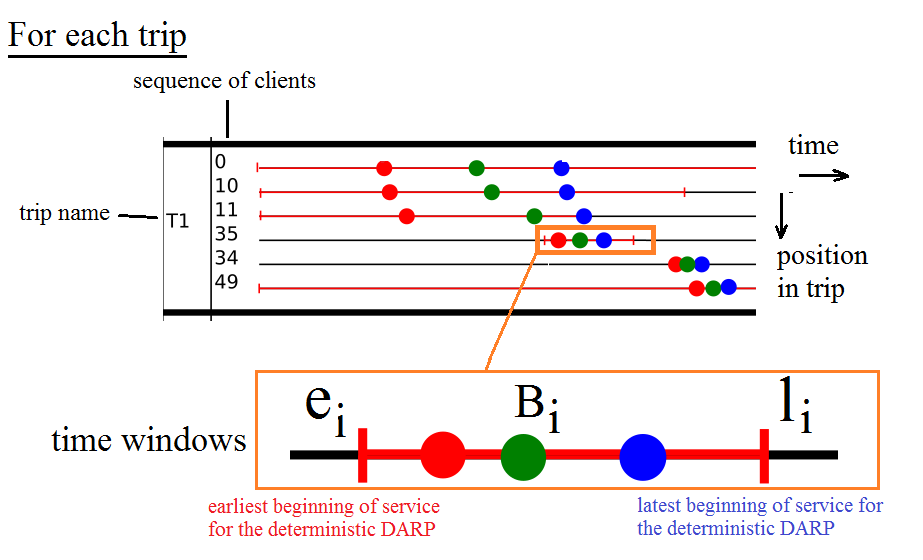
The aim of this paper is to tackle the dial-a-Ride Problem with stochastic transportation time between nodes. This transportation times are modeled by a Gauss distribution illustrated fig. 1. We propose a framework based on an Evolutionary local search to find robust solutions which can support the stochastic transportation time. This method uses a law approach to solve this problem and a simulation part to support the results. First the robustness for the best known solutions published for the Deterministic Dial-a-Ride Problem on instances proposed by (Cordeau and Laporte, 2003) are analyzed, then computational results obtain for the Stochastic Dial-a-Ride Problem are presented using the Evolutionary Local Search (ELS).
Instances
The method is benchmarked over the 20 instances introduced by Cordeau and Laporte, 2003 [1]. All the data are avalables on this web page, the initial source comming from :
http://neumann.hec.ca/chairedistributique/data/darp/.
Results
In the associated article, we provide a mathematical analysis of the Stochastic DARP and we define a robustness criteriona named  .
Two kind of results are avalaibles in the web page :
.
Two kind of results are avalaibles in the web page :
1- robustness of the best know solutions ever published for the Deterministic DARP instances are evaluated regarding transportation time variations.(Table 1)
2- robust solutions for the stochastic DARP are cumputed using the ELS approach with the robustness criterion. (Table 2)
| instance | m | n | c(BKS) | r_(P_1) | F_(P_1) | r_(P_2) | F_(P_2) | r_(P_3) | F_(P_3) |
|---|---|---|---|---|---|---|---|---|---|
| pr01 | 3 | 24 | 190.02 | 74.8% | 86.4% | 66.8% | 25.90% | 66.8% | 50.00% |
| pr02 | 5 | 48 | 301.34 | 76.8% | 85.4% | 48.6% | 28.40% | 48.6% | 72.60% |
| pr03 | 7 | 72 | 532.00 | 4.8% | 0.1% | 3.1% | 0.00% | 3.1% | 0.00% |
| pr04 | 9 | 96 | 570.25 | 14.3% | 0.3% | 9.4% | 0.00% | 9.4% | 0.10% |
| pr05 | 11 | 120 | 626.93 | 13.1% | 0.7% | 5.0% | 0.00% | 5.0% | 0.70% |
| pr06 | 13 | 144 | 785.26 | 3.9% | 0.0% | 3.0% | 0.00% | 3.0% | 0.00% |
| pr07 | 4 | 36 | 291.71 | 21.9% | 14.7% | 14.7% | 0.30% | 14.7% | 7.90% |
| pr08 | 6 | 72 | 487.84 | 8.9% | 0.2% | 5.9% | 0.00% | 5.9% | 0.20% |
| pr09 | 8 | 108 | 658.31 | 9.4% | 0.4% | 4.3% | 0.00% | 4.3% | 0.30% |
| pr10 | 10 | 144 | 851.82 | 1.3% | 0.0% | 0.6% | 0.00% | 0.6% | 0.00% |
| pr11 | 3 | 24 | 164.46 | 63.2% | 61.0% | 57.6% | 36.10% | 57.6% | 69.00% |
| pr12 | 5 | 48 | 295.66 | 32.0% | 5.8% | 25.0% | 0.20% | 25.0% | 3.70% |
| pr13 | 7 | 72 | 484.83 | 32.5% | 16.5% | 19.3% | 0.80% | 19.3% | 6.20% |
| pr14 | 9 | 96 | 529.33 | 59.3% | 64.6% | 35.6% | 9.20% | 35.6% | 27.80% |
| pr15 | 11 | 120 | 577.29 | 37.9% | 72.0% | 17.9% | 1.90% | 17.9% | 25.10% |
| pr16 | 13 | 144 | 730.67 | 16.2% | 11.1% | 7.5% | 0.20% | 7.5% | 3.40% |
| pr17 | 4 | 36 | 248.21 | 26.8% | 1.6% | 23.8% | 0.30% | 23.8% | 0.90% |
| pr18 | 6 | 72 | 458.73 | 62.2% | 72.9% | 43.8% | 17.00% | 43.8% | 54.40% |
| pr19 | 8 | 108 | 593.49 | 5.8% | 0.0% | 3.5% | 0.00% | 3.5% | 0.10% |
| pr20 | 10 | 144 | 785.68 | 3.8% | 0.0% | 2.8% | 0.00% | 2.8% | 0.10% |
| avg. | 24.7% | 6.02% | 16.13% |
Table 2. Robustness of solution after optimization
| instance | c(s) | gap_(P_1) | r_(P_1) | F_(P_1) | time |
|---|---|---|---|---|---|
| pr01 | 200.48 | 5.50% | 100.0% | 100.0% | 0.25 |
| pr02 | 307.11 | 1.92% | 100.0% | 100.0% | 1.25 |
| pr03 | 587.96 | 10.52% | 100.0% | 100.0% | 2.30 |
| pr04 | 643.75 | 12.89% | 100.0% | 100.0% | 7.37 |
| pr05 | 744.92 | 18.82% | 100.0% | 100.0% | 12.07 |
| pr06 | 979.78 | 24.77% | 100.0% | 100.0% | 21.92 |
| pr07 | 306.69 | 5.13% | 100.0% | 100.0% | 0.47 |
| pr08 | 573.65 | 17.59% | 100.0% | 100.0% | 2.68 |
| pr09 | 774.53 | 17.65% | 99.7% | 100.0% | 11.25 |
| pr10 | 1049.23 | 23.18% | 99.4% | 99.5% | 21.33 |
| pr11 | 168.81 | 2.64% | 100.0% | 100.0% | 0.28 |
| pr12 | 310.66 | 5.07% | 100.0% | 100.0% | 1.37 |
| pr13 | 527.10 | 8.72% | 100.0% | 100.0% | 3.70 |
| pr14 | 634.16 | 19.80% | 100.0% | 100.0% | 10.20 |
| pr15 | 634.08 | 9.84% | 100.0% | 100.0% | 19.93 |
| pr16 | 891.86 | 22.06% | 100.0% | 100.0% | 32.32 |
| pr17 | 266.83 | 7.50% | 100.0% | 100.0% | 0.58 |
| pr18 | 494.54 | 7.81% | 100.0% | 100.0% | 4.32 |
| pr19 | 699.70 | 17.89% | 100.0% | 100.0% | 12.43 |
| pr20 | 978.61 | 24.56% | 100.0% | 100.0% | 31.45 |
| avg. | 13.19 | 100.0% | 100.0% | 9.87 |
Legend
name : instance names
m : number of vehicles
n : number of clients
c(BKS) : Best Know Solution cost : Cordeau and Laporte 2003[1], Parragh and Schmid 2013[2], Braekers et al. 2014[3]
c(S) : Best Found Solution cost with ELS approch
: Robustness criterion
 : Robustness of the solution
gap(%) : gap, 100 * (valeur Avg – valeur OPT) / valeur OPT
time(min) : temps CPU total d'exécution en minutes de la méthode (moyenne sur 5 runs)
Result explanations
four different data are downloadables :
1-the instances: the same format as define by Cordeau and Laporte, 2003 [1]
2-solution node lists: reduice solution with only the node lists associeted with trip in the solution
3-solution detailled : included the values affected for all the variables introduices in the article (A,B,D,L...)
4-solution illustrations
References
[1]. J-F. Cordeau and G. Laporte. A tabu search heuristic for the static multi-vehicle dial-a-ride problem. Transportation Research Part B Methodological, 37 (2003), pp. 579–94.
[2]. S.N. Parragh and V. Schmid. Hybrid column generation and large neighborhood search for the dial-a-ride problem. Computers & Operations Research, 40 (2013), pp. 490–497
[3]. K. Braekers, A. Caris and G. K. Janssens. Exact and meta-heuristic approach for a general heterogeneous dial-a-ride problem with multiple depots. Transportation Research Part B: Methodological, 67 (2014),pp. 166-186.
