LoRaWAN Project
Analytic analysis
We studied the on-the-air activation procedure, which allows nodes to join an existing network. To do this, we propose a Markov chain model of the activation procedure, and we derive two important performance metrics: the expected delay to complete the activation and the required energy. The study is based on the EU863-873 MHz regional settings for a single gateway.
Markov chain model
We present the Markov chain model based on the following hypothesis we used for simplification reasons.
- Concerning the physical layer: We assume that when a transmitter sends a preamble, the receiving node detects this preamble, thanks to the robust CSS modulation which is central in the physical layer design of LoRaWAN. We assume that when several transmitters send a preamble simultaneously, the receiving node detects that the preamble is incorrect.
- Concerning the gateway: We assume that there is a single gateway. We assume that the gateway is sending only join accept frames (that is, there is no confirmed data requiring acknowledgments), and that the gateway is not sending a frame while a join request frame is sent.
- concerning the nodes: We assume that the nodes use the same data rate DR0 for the activation procedure (which is the smallest data rate, ensuring the strongest link quality) and for the data transmission (of activated nodes). We assume that the MAC payload of data frames is between 13 bytes and 18 bytes (this assumption has a small impact on the Markov chain). We also assume that the detection of the preamble lasts for the whole duration of the preamble.
Model
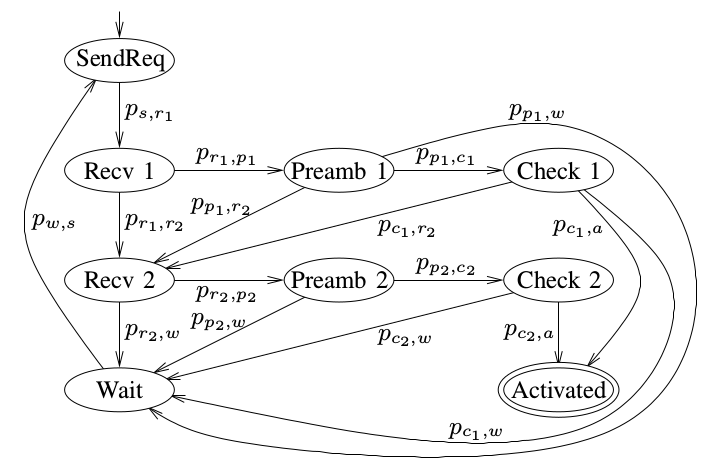
The figure below represents our Markov chain model for the activation procedure of LoRaWAN. In the send request state, the node sends a join request and goes to the receive 1 state. In the receive 1 state, the node opens the first receive window. If a preamble is detected, the node goes to the preamble 1 state, then to the check 1 state if the preamble is correct, and then to the activated state if the join accept is successfully received. Otherwise, the node goes either to the receive 2 state or to the wait state, depending on the duration of the potential preamble and frame received. In the receive 2 state, the node opens the receive window, and follows a process similar to the receive 1 state. In the wait state, the node waits for a given amount of time until it can reuse a sub-band, and goes back to the send request state. Finally, in the activated state, the node has successfully joined the network and is ready to send data.
Performance evaluation
We evaluate the performance of the activation procedure, in terms of the expected delay and the expected energy consumption.
Delay
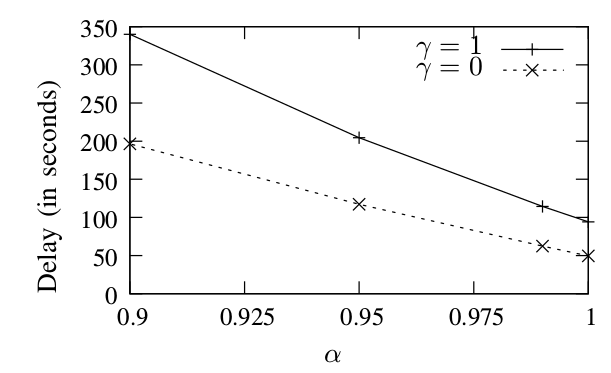
The figure below presents the delay as a function of the channel quality α and the opened received window (γ=1 or the first received window). The impact of the channel quality on the expected delay is significant. When the channel quality is low (α=0.9), join requests or join accepts might be lost, which causes the node to go to the wait state often and induces a large delay. The impact of γ, which determines the choice of receive window, is also significant for the delay. Indeed, when γ=1, collisions with transmissions from other nodes are likely to occur during either the transmission of the join request, or the transmission of the join accept. These collisions cause the node to go back to the wait state. When γ=0, collisions can occur during the transmission of the join request, but they cannot occur during the transmission of the join accept, as the gateway is the only node allowed to transmit on the channel dedicated to the second receive window.
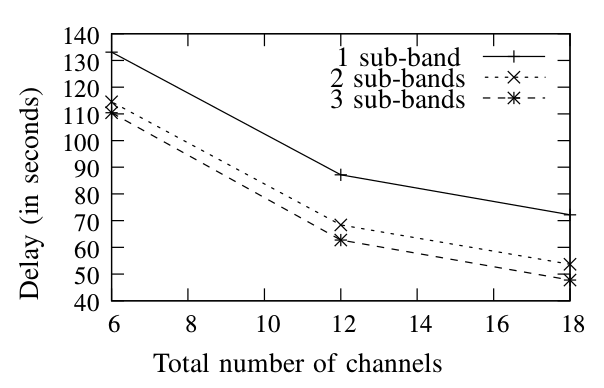
The figure below presents the delay as a function of the total number of channels and the number of available sub-bands. The expected delay decreases with the number of channels as collisions during the transmission of the send request are less likely when there is a large number of channels. The expected delay is impacted by the number of sub-bands in two ways: (i) when the number of sub-bands increases, the time duration of the wait state is reduced as it is directly impacted by the number of sub-bands, and (ii) when the number of sub-bands increases, the traffic increases, which increases the delay. However, the reduction of the wait duration is more significant than the increase in the number of collisions.
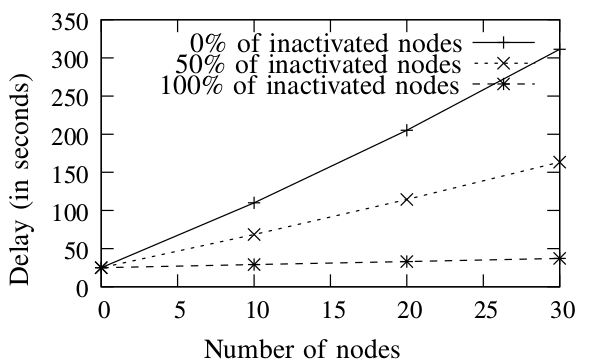
The figure below presents the delay as a function of the number of nodes and proportion of inactivated nodes, in three scenarios: when no node is activated, when half of the nodes are activated, and when all nodes are activated. The delay increases with the number of nodes in the network for all the scenarios. In the first scenario, the delay increases slightly as all nodes send their join requests with a small duty cycle of 0.1%. Thus, collisions do not happen frequently. In the second scenario, the delay increases consistently. Indeed, the activated nodes send data frames with a larger duty cycle of 1%. In this case, collisions and interferences appear more frequently. The worst case scenario is the third scenario, in which all nodes are activated. All nodes send data frames with a large duty cycle of 1%, and thus, the delay increases drastically.
Energy consumption
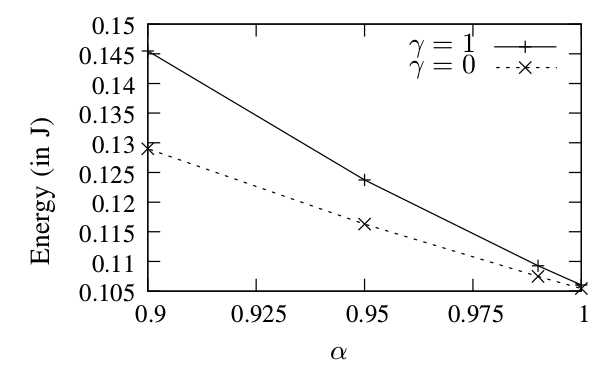
The figure below present the energy as a function of α and γ. The impact of the channel quality α on the expected energy consumption is important. Indeed, a bad channel quality yields to frame loss and thus forces a node to go back to the wait state often in order to reach the activated state. The larger the energy consumption when γ=1 is the energy cost of retransmitting join requests (and additional listening periods)
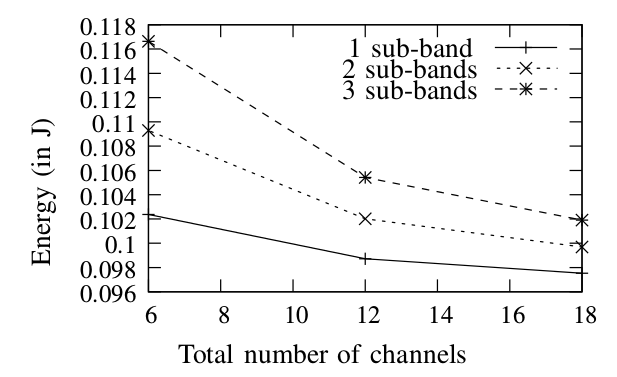
The figure below presents the energy consumption of an activation as a function of the total number of channels and on the number of available sub-bands. The energy consumption decreases with the total number of channels as the probability of collisions decreases when the number of channels per sub-bands is large. Moreover, when the number of sub-bands is large, the node transmits join requests more frequently (as the duration of the wait state depends on the number of sub-bands).
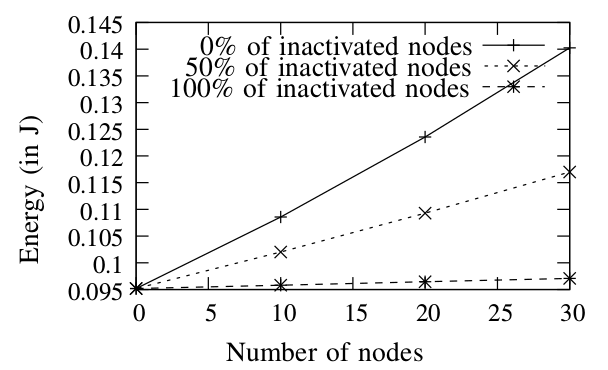
The figure below presents the energy as a function of the number of nodes and proportion of inactivated nodes. The energy consumption follows the same behavior as the delay as it depends on the time spent (and the energy consumed) in each state. When the number of activated nodes increases in the network, the energy consumption of an activation increases. Moreover, the energy consumption increases with the number of nodes in the network as the number of collisions increases in this case.